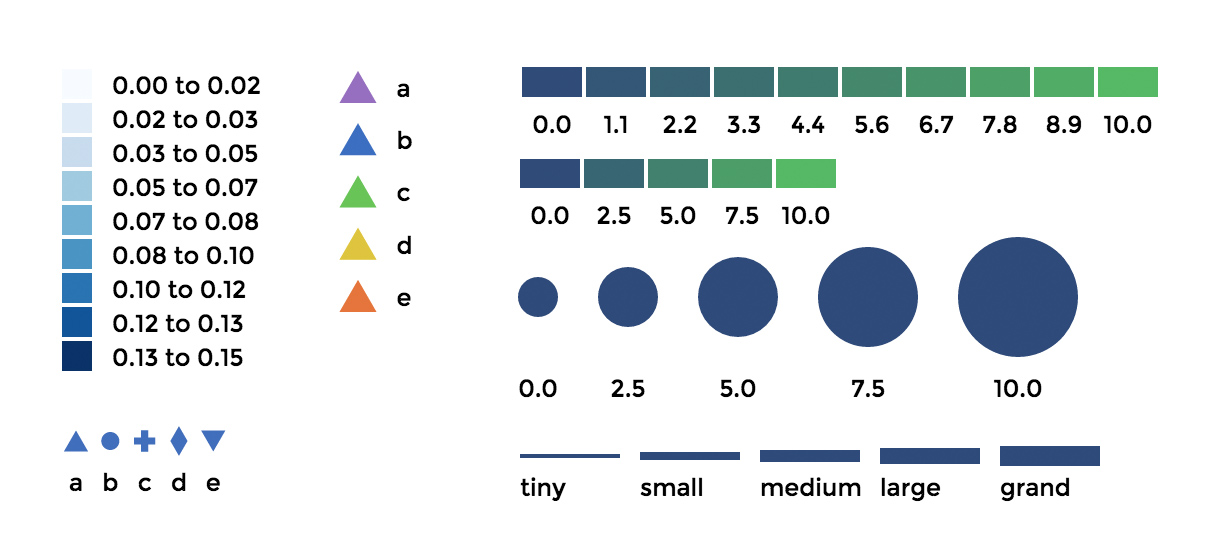
d3 SVG Legend (v4)
Tired of making legends for your data visualizations? Me too, enjoy.
A library to make legends in svg-land easy as pie.

By Susie Lu
Tired of making legends for your data visualizations? Me too, enjoy.
A library to make legends in svg-land easy as pie.

By Susie Lu
This is the version compatible with d3v4, please go here for the version compatible with d3v3
Changes when moving to d3v4 of this component
You can add the latest version of d3-legend hosted on cdnjs.
https://cdnjs.com/libraries/d3-legend
You must include the d3 library before including the legend file. Then you can simply add the compiled js file to your website:
Already using d3? Great! You can add the d3 legend as a node module by running:
npm i d3-svg-legend -S
The full source code is available on github. I would love to hear from you about any additional features that would be useful, please say hi on twitter @DataToViz.
var quantize = d3.scaleQuantize()
  .domain([ 0, 0.15 ])
  .range(d3.range(9).map(function(i) { return "q" + i + "-9"; }));

var svg = d3.select("svg");

svg.append("g")
  .attr("class", "legendQuant")
  .attr("transform", "translate(20,20)");

var legend = d3.legendColor()
  .labelFormat(d3.format(".2f"))
  .useClass(true)
  .title("A really really really really
    really long title")
  .titleWidth(100)
  .scale(quantize);

svg.select(".legendQuant")
  .call(legend);
var thresholdScale = d3.scaleThreshold()
  .domain([ 0, 1000, 2500, 5000, 10000 ])
  .range(d3.range(6)
  .map(function(i) { return "q" + i + "-9"}));

var svg = d3.select("svg");

svg.append("g")
  .attr("class", "legendQuant")
  .attr("transform", "translate(20,20)");

var legend = d3.legendColor()
    .labelFormat(d3.format(".2f"))
    .labels(d3.legendHelpers.thresholdLabels)
    .useClass(true)
    .scale(thresholdScale)

/*
----legendHelpers.thresholdLabels----
function({
  i,
  genLength,
  generatedLabels,
  labelDelimiter
}) {
  if (i === 0) {
    const values = generatedLabels[i].split(` ${labelDelimiter} `)
    return `Less than ${values[1]}`
  } else if (i === genLength - 1) {
    const values = generatedLabels[i].split(` ${labelDelimiter} `)
    return `${values[0]} or more`
  }
  return generatedLabels[i]
}

*/

svg.select(".legendQuant")
  .call(legend);
var log = d3.scaleLog()
    .domain([ 0.1, 100, 1000 ])
    .range(["rgb(46, 73, 123)", "rgb(71, 187, 94)"]);

var svg = d3.select("svg");

svg.append("g")
  .attr("class", "legendLog")
  .attr("transform", "translate(20,20)");

var logLegend = d3.legendColor()
    .cells([0.1, 5, 10, 50, 100, 500, 1000])
    .scale(log);

svg.select(".legendLog")
  .call(logLegend);
var linear = d3.scaleLinear()
  .domain([0,10])
  .range(["rgb(46, 73, 123)", "rgb(71, 187, 94)"]);

var svg = d3.select("svg");

svg.append("g")
  .attr("class", "legendLinear")
  .attr("transform", "translate(20,20)");

var legendLinear = d3.legendColor()
  .shapeWidth(30)
  .orient('horizontal')
  .scale(linear);

svg.select(".legendLinear")
  .call(legendLinear);
var linear = d3.scaleLinear()
  .domain([0,10])
  .range(["rgb(46, 73, 123)", "rgb(71, 187, 94)"]);

var svg = d3.select("svg");

svg.append("g")
  .attr("class", "legendLinear")
  .attr("transform", "translate(20,20)");

var legendLinear = d3.legendColor()
  .shapeWidth(30)
  .cells(10)
  .orient('horizontal')
  .scale(linear);

svg.select(".legendLinear")
  .call(legendLinear);
var linear = d3.scaleLinear()
  .domain([0,10])
  .range(["rgb(46, 73, 123)", "rgb(71, 187, 94)"]);

var svg = d3.select("svg");

svg.append("g")
  .attr("class", "legendLinear")
  .attr("transform", "translate(20,20)");

var legendLinear = d3.legendColor()
  .shapeWidth(30)
  .cells([1, 2, 3, 6, 8])
  .orient('horizontal')
  .scale(linear);

svg.select(".legendLinear")
  .call(legendLinear);
var sequentialScale = d3.scaleSequential(d3.interpolateRainbow)
  .domain([0,10]);

var svg = d3.select("svg");

svg.append("g")
  .attr("class", "legendSequential")
  .attr("transform", "translate(20,20)");

var legendSequential = d3.legendColor()
    .shapeWidth(30)
    .cells(10)
    .orient("horizontal")
    .scale(sequentialScale)

svg.select(".legendSequential")
  .call(legendSequential);
var ordinal = d3.scaleOrdinal()
  .domain(["a", "b", "c", "d", "e"])
  .range([ "rgb(153, 107, 195)", "rgb(56, 106, 197)", "rgb(93, 199, 76)", "rgb(223, 199, 31)", "rgb(234, 118, 47)"]);

var svg = d3.select("svg");

svg.append("g")
  .attr("class", "legendOrdinal")
  .attr("transform", "translate(20,20)");

var legendOrdinal = d3.legendColor()
  //d3 symbol creates a path-string, for example
  //"M0,-8.059274488676564L9.306048591020996,
  //8.059274488676564 -9.306048591020996,8.059274488676564Z"
  .shape("path", d3.symbol().type(d3.symbolTriangle).size(150)())
  .shapePadding(10)
  //use cellFilter to hide the "e" cell
  .cellFilter(function(d){ return d.label !== "e" })
  .scale(ordinal);

svg.select(".legendOrdinal")
  .call(legendOrdinal);
var linearSize = d3.scaleLinear().domain([0,10]).range([10, 30]);

var svg = d3.select("svg");

svg.append("g")
  .attr("class", "legendSize")
  .attr("transform", "translate(20, 40)");

var legendSize = d3.legendSize()
  .scale(linearSize)
  .shape('circle')
  .shapePadding(15)
  .labelOffset(20)
  .orient('horizontal');

svg.select(".legendSize")
  .call(legendSize);
var lineSize = d3.scaleLinear().domain([0,10]).range([2, 10]);

var svg = d3.select("svg");

svg.append("g")
  .attr("class", "legendSizeLine")
  .attr("transform", "translate(0, 20)");

var legendSizeLine = d3.legendSize()
      .scale(lineSize)
      .shape("line")
      .orient("horizontal")
      //otherwise labels would have displayed:
      // 0, 2.5, 5, 10
      .labels(["tiny testing at the beginning",
        "small", "medium", "large", "grand,
        all the way long label"])
      .labelWrap(30)
      .shapeWidth(40)
      .labelAlign("start")
      .shapePadding(10);

svg.select(".legendSizeLine")
  .call(legendSizeLine);
var triangleU = d3.symbol().type(d3.symbolTriangle)(),
  circle = d3.symbol().type(d3.symbolCircle)(),
  cross = d3.symbol().type(d3.symbolCross)(),
  diamond = d3.symbol().type(d3.symbolDiamond)(),
  star = d3.symbol().type(d3.symbolStar)();

//example output of d3.svg.symbol().type('circle')();
//"M0,4.51351666838205A4.51351666838205,4.51351666838205 0 1,1 0,
//-4.51351666838205A4.51351666838205,4.51351666838205 0 1,1 0,4.51351666838205Z"

var symbolScale =  d3.scaleOrdinal()
  .domain(['a longer label','b','c', 'd', 'e'])
  .range([ triangleU, circle, cross, diamond, start] );

var svg = d3.select("svg");

svg.append("g")
  .attr("class", "legendSymbol")
  .attr("transform", "translate(20, 20)");

var legendPath = d3.legendSymbol()
  .scale(symbolScale)
  .orient("horizontal")
  .labelWrap(30)
  .title("Symbol Legend Title")
  .on("cellclick", function(d){alert("clicked " + d);});

svg.select(".legendSymbol")
  .call(legendPath);
| Function | Color | Size | Symbol |
|---|---|---|---|
| scale | |||
| cells | |||
| cellFilter | |||
| orient | |||
| ascending | |||
| shape | |||
| shapeWidth | |||
| shapeHeight | |||
| shapeRadius | |||
| shapePadding | |||
| useClass | |||
| classPrefix | |||
| title | |||
| titleWidth | |||
| labels | |||
| labelAlign | |||
| labelFormat | |||
| locale | |||
| labelOffset | |||
| labelDelimiter | |||
| labelWrap | |||
| on |
NOTES
Huge thanks to Elijah Meeks for discussing ideas and encouraging me to complete this project.
The styling and layout of this page is made with another project of mine, minimal-ui.
The fonts on this page are provided by Google Fonts, and created by Julieta Ulanovsky and David Perry.
Using Prism for syntax highlighting.
And of course, thanks d3.js for creating such a lovely project and Mike Bostock for providing examples on how to make your own components.